Checking RAM Usage on Linux, you are likely trying to figure out how to monitor how much of your computer’s memory is being used. Maybe you’re noticing your system is running slow, or you just want to keep track of your system’s performance. Whether you’re new to Linux or just want to dive deeper into system management, you’re here to understand how to check RAM usage and make sure everything is running smoothly.
In this post, I’ll walk you through several simple and effective ways to check RAM usage on your Linux system. By the end, you’ll be familiar with commands like free, top, and htop, and you’ll know exactly how to read the memory data provided. If you’re facing any performance issues or just want to optimize your system, this article will give you the tools to keep an eye on your system’s memory and improve its efficiency.
To check RAM usage on Linux, there are several commands and tools you can use, depending on your needs and experience level. For beginners, the free command is a great starting point, offering a simple overview of memory usage, including details on total, used, and available memory. For more real-time stats, top provides a dynamic view of memory usage and running processes, while htop offers a more user-friendly interface (though it may need to be installed). If you prefer a GUI, tools like GNOME System Monitor or KSysGuard can give you an intuitive way to view memory usage. Advanced users might opt for commands like vmstat or ps to dive deeper into specific memory or process details.
Below are the most common and effective methods:
1. Using free Command
The free command provides a quick overview of memory usage, including total, used, and free RAM.

- Explanation:
total: Total installed RAM.used: RAM currently in use.free: Unused RAM.buff/cache: RAM used for caching (can be freed if needed).available: Estimate of how much memory is available for starting new applications.
2. Using top Command
The top command provides a real-time, dynamic view of system processes and memory usage.
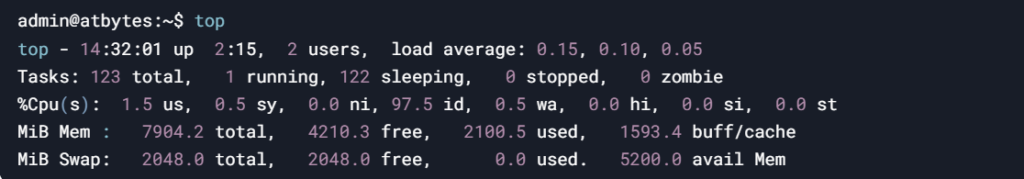
- Explanation:
- Press
qto exit. - The
Memline shows total, free, and used RAM. - The
Swapline shows swap space usage.
3. Using htop Command
htop is an interactive and user-friendly alternative to top. It provides a color-coded display of memory usage.

- Explanation:
- RAM usage is displayed at the top of the interface.
- Use the arrow keys to navigate and
qto quit.
4. Using vmstat Command
The vmstat command provides a summary of memory, swap, and system activity.
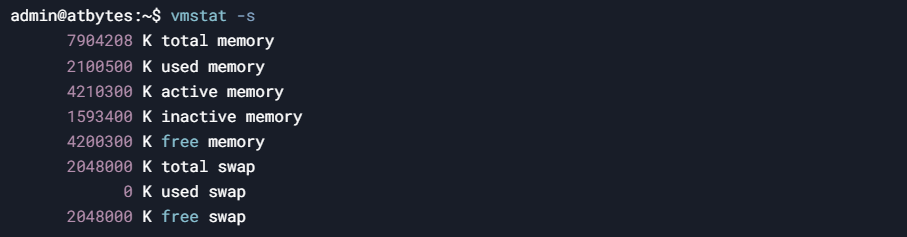
- Explanation:
- Displays detailed memory and swap statistics in kilobytes (KB).
5. Using /proc/meminfo
The /proc/meminfo file contains detailed information about the system’s memory usage.
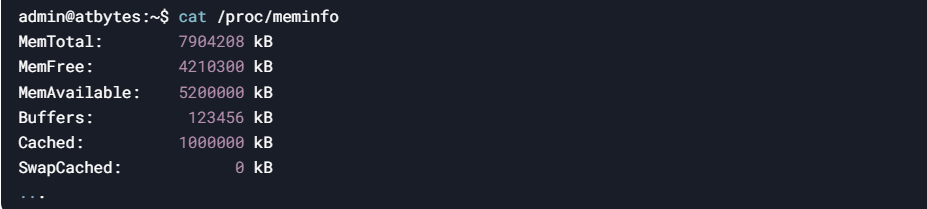
- Explanation:
MemTotal: Total usable RAM.MemFree: Unused RAM.MemAvailable: Estimate of memory available for starting new applications.
6. ps Command
Check per-process memory usage with ps aux –sort=-%mem | head -n 10

Key Columns in the Output
USER: The user who owns the process.PID: Process ID.%CPU: Percentage of CPU usage.%MEM: Percentage of memory usage.VSZ: Virtual memory size (in KB).RSS: Resident Set Size (physical memory used, in KB).COMMAND: The command that started the process.
Summary of Best Methods
| Task | Command |
|---|---|
| Quick overview | free -h |
| Detailed analysis | htop |
| Process-level memory | ps aux --sort=-%mem |
| Real-time monitoring | top or vmstat |
Key Notes
- Buffers/Cache: Linux uses free RAM for disk caching (listed under
buff/cacheinfree -h). This memory is reclaimed automatically when needed. - Available vs Free: Focus on the
availablemetric, as it accounts for reclaimable cache. - Memory Leaks: Use
psortopto identify processes consuming excessive RAM over time.